
Facial Recognition Inference Pipeline for Sentiment Analysis

Daniel Kaempf July 26, 2021
Automated Classification of Facial Recognition Tiles
Isidora Stankovic, Nevena Milenkovic, Goran Benak, Miljan Vuletic, Nikola Milojevic, Debmalya Biswas — Darwin Edge, Switzerland
Abstract. Facial recognition platforms based on Computer Vision/Deep Learning techniques have considerably matured over the last few years. This has led to their sometimes controversial usage in surveillance use-cases. However, it has also enabled many healthcare use-cases, e.g., sentiment analysis, assessing (intensity of) pain based on facial expressions. In this work, we take a detailed look at the typical facial recognition inference pipeline. Tiles generated from face detectors are not always suitable for feature detection as they sometimes do not contain faces. To overcome this, we propose a Canny Edge Detection algorithm for automated classification of ‘Correct’ and ‘Bad’ tiles.

1. Facial Recognition Inference Pipeline
Computer Vision (CV) platforms have considerably matured over the last few years. This has been enabled by the advent of Deep Learning, e.g., Convolutional Neural Network (CNN) based architectures that allow extracting meaningful, contextual images from given images. This maturity is reflected in the availability of multiple Cloud based CV APIs, e.g., Amazon Rekognition, Azure Face API, Google Cloud Vision API.
Facial recognition is a sub-field of CV that enables automated analysis of human facial expressions, extracting and classifying the key facial attributes, e.g., emotion and intention. In this paper, we focus on the applications of facial recognition in healthcare. The patients’ facial expressions can provide a variety of information regarding the underlying disease, enabling effective diagnosis and treatment [9]. This is especially applicable in the case of small children [1], (elderly) patients suffering from neurodegenerative diseases and patients in emergency department; who are incapable of expressing their feelings [8,6].
The goal of a typical facial recognition inference pipeline is to determine presence or absence of selected AUs (fundamental actions of individual facial muscles or groups of facial muscles) for a given input image of a human face.
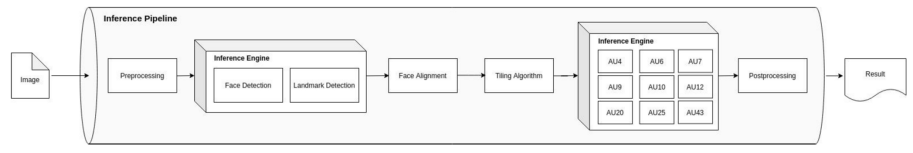
Fig. 1 shows the pipeline. The inference engine performs model inference for face detection, landmark detection and AU classification. Pre and post processing stages are responsible for preparing the inference inputs and interpreting the inference outputs, transforming them eventually to a machine-and-human readable form (JSON output).
Face detection
The face detection stage detects faces in the input image. The face detection post-processing algorithm normalises prediction data and implements the Non-Maximum Suppression algorithm [7] to maximise the detection precision. The output of the face detection is a list of bounding boxes framing the detected faces.
Landmark Detection
The landmark detection stage uses the face-detection bounding boxes and finds facial landmarks for all of them. The facial landmarks define key points of the face: eyes, eyebrows, nose, mouth, jawline. The process of detection consists of face cropping and localisation of 68 facial landmarks representing the key points of interest. The pipeline supports fine tuning of the models for particular fields of application and target population segments (e.g., improved face detection for infants; specialised face detection for certain demographic regions). The output of the face landmark detection is a list of bounding boxes with facial landmarks.
Face Alignment
The face alignment stage is responsible for the face data normalisation and includes the implementation of affine transformations that rotate and scale the detected face data, if identified as needed. The criterion we use for triggering the alignment is whether the eyes lie on a horizontal line. Other head-pose related criteria could be employed. One could use this stage to discard images for which the available information does not guarantee successful alignment outcome. The output of this stage is an aligned face ready for the tile generation.
Tiling Algorithm
The tiling algorithm gets the aligned face data and uses the face detection bounding box together with the facial landmarks to crop the input, transform it to grayscale, and downscale it to the desired tile size. We use top and bottom face tiles to cover target AUs and assign them based on their face position (top AUs to the top tile, bottom AUs to the bottom tile). The pipeline also supports changing the current tile size and finding the optimal size through AU classification retraining to maximise the AU detection accuracy. The output tiles of this stage are inputs of the AU classification process.
AU Classification
The AU classification stage consumes the input tiles and classifies them regarding the presence and absence of the given AUs. The output of the AU classification is the list of detected AUs and goes toward the post-processing stage responsible for assembling the final result represented by a human-readable JSON object.
In this work, we focus on improvements to the Tiling Algorithm, and propose a Canny Edge Detection algorithm for automated classification of ‘Correct’ and ‘Bad’ tiles.
The algorithm is presented in Section 2.2. Section 2.1 discusses related work positioning the contribution with respect to existing literature. We provide experimental results on an image set of 500 images, outlining the logic used to compute the hysteresis threshold.
2. Canny Edge Detection Algorithm for Facial Tiles
2.1 Related Work
In [3], the authors propose an edge-based face detection method that works on grayscale images. The Hausdorff distance is used as a similarity measure between a general face model and possible instances of the object within the image.
Feature Ordering by Cross Validation [4] for Face Detection presents the method to determine the order of feature (attention) points for face detection. The order of feature points is determined in terms of the classification ability to face and non-face images (cross validation).
Canny Edge Detection has been previously proposed for facial expression recognition in [2], where the authors propose to use this method to extract eyes and lips based on their position on the face. These features are used to train a neural network to determine which facial expressions are present (normal, sad, smile, surprise). In the sequel, we propose a method that classifies tiles into two groups (faces and non-faces) based on Canny Edge Detection.
2.2 Algorithm
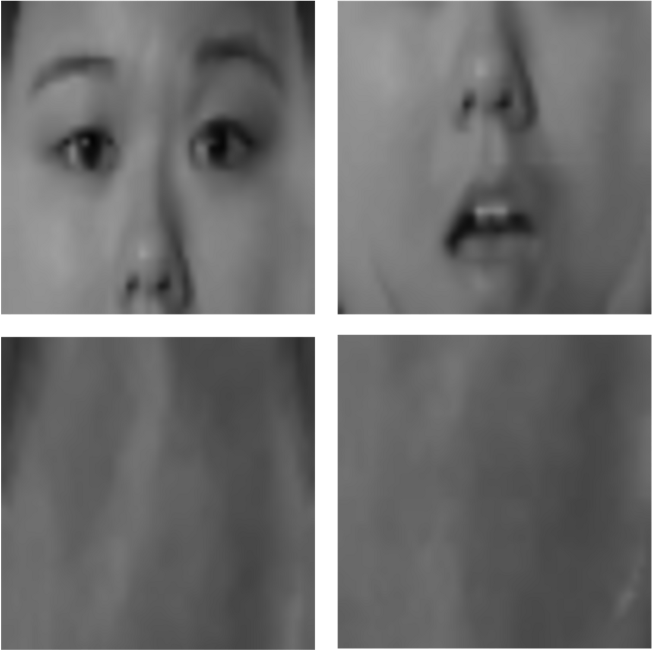
For an intuitive understanding of the proposed algorithm, consider the images in Fig. 2 that represent typical examples of a correct top and bottom tile, followed by bad top and bottom tiles, respectively.
By observing the examples, we can see that correct tiles have more features and bad tiles are mostly blurry. We outline a Canny Edge Detection Algorithm to extract those features. The algorithm steps are outlined below:
1. Noise Reduction. Smoothen the image with Gaussian filter to reduce noise and unwanted details and textures.
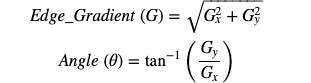
2. Finding Intensity Gradient of the Image. Smoothened image is filtered with Sobel kernel in both horizontal and vertical directions to get first derivative in horizontal direction G_x and vertical direction G_y.
3. Non-Maximum Suppression. Remove any unwanted pixel which may not constitute the edge (as the edges may be broadened in Step 1.). For this, every pixel is checked if it is local maximum in its neighbourhood in the direction of the gradient.
4. Hysteresis Thresholding. This stage decides whether the edge is really an edge or not. For this we need two threshold values: minimum and maximum value. Any edges with intensity gradient more than maxVal are sure to be edges and those below minVal are sure to be non-edges — so discarded. Those which lie between these two thresholds are classified edges or non-edges based on their connectivity. If they are connected to “sure-edge” pixels, they are considered to be part of edges. Otherwise, they are also discarded.
In our case, the selected values are 20 for the minimum value and 120 for the maximum value. Also, another necessary parameter is sigma, which affects how blurry image will be after the noise reduction. We used 0.2 for sigma, since it gave the best results.

Fig. 3 shows examples of Top and Bottom tiles after the use of Canny Edge Detection.
Next step is to compare number of white pixels, as they correspond to detected edges in an image, with black ones. For top tiles we only examined the top half of the image, since it contains majority of the edges. Similarly, for the bottom tiles, we only looked into the central part of the image, which contains features like nose and lips.
2.3 Experimental Evaluation — Threshold
In this step, we define the threshold based on which the final decision will be made, that is, whether tile is correct or not. The value that gave the best results on our experimental data is 90, which means that 90 white pixels is lower limit for correct tiles. In this case, the total number of tiles that are not classified properly is 16 (12 bad tiles were classified as correct, and 4 correct tiles were labeled as bad). Since the total number of detected images is 535, the accuracy in this case is around 97%.
When it comes to lower values, e.g. 60, the accuracy is similar to the one we get with chosen threshold. But we noticed that the number of bad tiles classified as correct was much larger and there was just one correct tile classified as bad. The opposite was observed for the greater threshold values, that is, the algorithm more frequently makes the decision that the correct tile is bad. In this case, for threshold value 100, there were 9 correct tiles poorly classified. This happens because the lower threshold allows tiles with fewer edges to be detected as correct. On the contrary higher threshold requires more detected edges in order to label a tile as correct.
We note that changing minimum and maximum values of hysteresis threshold, and adjusting white pixel threshold leads to the same results. If at least one, top or bottom tile, is not correct, final decision will be that the whole image is bad.
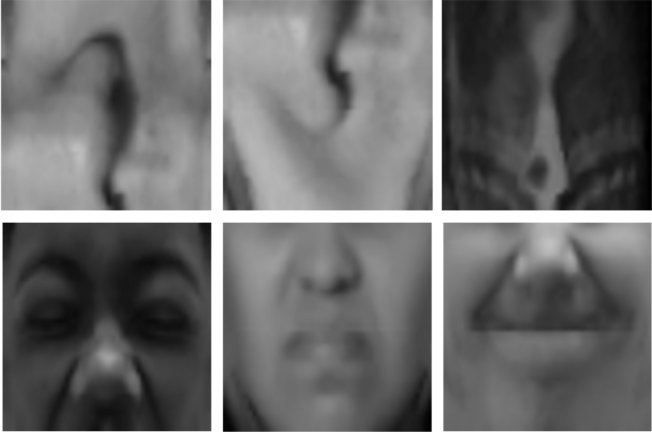
Fig. 4 (top row) shows a few instances where this method does not make the right decision. First two images are rotated faces, but we don’t classify them as correct. The reason why last tile is classified as correct is existence of certain features that are considered as edges, but don’t belong to the face. On the other hand, edges on the images in Fig. 4 (bottom row) are not defined enough, so they aren’t detected.
We have seen promising results in solving the above problem due to rotated images by detection of image symmetry [5]. Looking at the vertical axis of symmetry, most correct tiles are symmetric to a certain extent, so we can quantify that, and compare it with predetermined threshold — to discard rotated tiles.
We have developed an annotation tool to visualize the predictions made by the Canny Edge Detection algorithm — Fig. 5. Users can manually change the predictions made by the algorithm, by checking or unchecking checkboxes for every image. Once the user has gone through the whole dataset, results will be saved upon clicking the Submit Dataset button. This acts as a feedback loop to generate ground truths for the input images.

3. Conclusion
In this work, we focused on improvements to the Tiling Algorithm, which forms a critical part of the facial recognition inference pipeline. We proposed a Canny Edge Detection algorithm for automated classification of tiles, and showed its efficiency on an experimental image set of 500 images. We also presented an annotation tool that allows us to both capture the algorithm predictions, and generate ground truths as a feedback loop to further improve the algorithm.
In future, we plan to extend the automated classification to AUs, enabling us to cater to the full facial recognition inference pipeline for healthcare applications (e.g., sentiment and pain analysis).
References
- Bringuier, S., Macioce, V., Boulhais, M., Dadure, C., Capdevila, X.: Facial Expressions of Pain in Daily Clinical Practice to assess Postoperative Pain in Children: Reliability and validity of the Facial Action Summary Score. European Journal of Pain (EJP) 25(5), 1081–1090 (2021)
- CHEN, X., CHENG, W.: Facial Expression Recognition based on Edge Detection. Computer Science and Engineering Survey (IJCSES) 6(2) (2005)
- Jesorsky, O., Kirchberg, K.J., Frischholz, R.: Robust Face Detection Using the Hausdorff Distance. In: Proceedings of the Third International Conference on Audio- and Video-Based Biometric Person Authentication. p. 90–95. AVBPA (2001)
- Kurita, T., Hotta, K., Mishima, T.: Feature Ordering by Cross Validation for Face-Detection. In: Proceedings of the IAPR Workshop on Machine Vision Applications. pp. 211–214. MVA (2000)
- Loy, Gareth and Eklundh, Jan-Olof: Detecting Symmetry and Symmetric Constellations of Features. In: Computer Vision — ECCV 2006. pp. 508–521 (2006)
- Othman, E., Werner, P., Saxen, F., Al-Hamadi, A., Gruss, S.,Walter, S.: Automatic vs. Human Recognition of Pain Intensity from Facial Expression on the X-ITE Pain Database. Sensors 21(9) (2021). https://doi.org/10.3390/s21093273
- Ross Girshick: Fast R-CNN. In: Proceedings of the IEEE International Conference on Computer Vision (ICCV) (2015)
- Wang, K.C., Seak, C.J., Tsai, F.S., Chien, C.Y., Lee, C.C., Ng, C.J., Wang, B.C., Weng, Y.M.: Facial Expressions of Pain Among Patients in the Emergency Department (2020). https://doi.org/10.21203/rs.3.rs-94475/v1
- Yao, L., Wan, Y., Ni, H., Xu, B.: Action Unit Classification for Facial Expression Recognition using Active Learning and SVM. Multimedia Tools and Applications (2021)